Book Details
- ISBN: 979-8282625813
- Published: May 5, 2025
- Categories: Books Computers & Technology Web Development & Design Programming JavaScript
Gallery

Speak with Visualizations
About This Book
This book was born from countless late-night debugging sessions. I lost track of how many times I wrestled with graphical dashboards that almost worked - the data was accurate, the charts were colorful, yet the users kept asking, "So what?" Those long hours led me to a truth: Technical mastery of visualization tools means nothing without an equal command of human perception and analytical storytelling. It's not enough to simply display data; we have to make it meaningful. A well-designed visualization should do more than inform - it should guide the viewer to insight, helping them see patterns, spot outliers, and grasp the bigger picture. Over time, I realized that the best visualizations are bridges between raw numbers and human understanding, blending art and science to turn data into decisions. Those nights of trial and error sharpened my obsession with one question: How do we make data not just visible, but valuable? This book is my attempt to share what I've learned - practical techniques, psychological principles, and real-world examples that can help anyone transform dry statistics into compelling stories. Whether you're a data analyst, a business leader, or just someone who loves a good data visualization, my hope is that these lessons will help you create visuals that don't just sit on a screen, but spark action. But insight doesn't happen by accident. The most effective visualizations are intentional, designed with the audience's needs - and limitations - in mind. Cognitive biases, attention spans, and even color perception all play a role in whether a chart enlightens or confuses. That's why this book doesn't just teach how to build visualizations; it explores why certain designs work and others fall flat. You'll learn to anticipate the questions your viewers will ask - and craft visuals that answer them before they're even spoken. The tools we use matter, but they're only part of the equation. A stunning infographic in the latest software can still miss the mark if it prioritizes style over substance. That's why I focus on principles that apply whether you're working with Excel, Python, or a whiteboard. The best visualizers aren't defined by their toolkit - they're defined by their ability to think critically about data and communicate with clarity. And let's be honest: Data can be intimidating. For many, a spreadsheet full of numbers feels like a locked door. A great visualization is the key - one that doesn't just reveal the data, but makes it inviting. That's the magic of this craft: taking something complex and making it feel intuitive, even obvious. When done right, a visualization doesn't just present facts - it tells a story that resonates, one that sticks in the mind long after the screen goes dark. So consider this book a challenge - to move beyond default charts and lazy defaults, to treat every visualization as an opportunity to change how someone thinks. Because in a world drowning in data, the ability to make it clear, compelling, and human isn't just useful - it's indispensable.
Key Features
- Comprehensive coverage of Books topics
- Practical examples and real-world applications
- Clear explanations suitable for beginners and experts
- Latest trends and techniques in the field
- Exercises and challenges to test your knowledge
In the News
Tata Electronics, a major tech supplier to Apple and Tesla, confirms data breach
techcrunch.com • Jun 22, 2026
The incident comes as Tata Electronics expands its role in global books supply chains....
This WD Blue SSD is almost 60% off at Best Buy - and I recommend it
www.zdnet.com • Jun 22, 2026
The 2TB WD Blue SN5100 SSD is equally at home in both workstations and gaming PCs - and right now at Best Buy, you can save big on one....
June Prime Day live blog 2026: We're tracking Amazon deals on SSDs, TVs, laptops and more
www.zdnet.com • Jun 22, 2026
LIVE: Prime Day 2026 early deals are here. Follow our live blog for real-time tracking on the lowest prices for 4K TVs, M5 MacBooks, Samsung devices, SSDs, and more tech....
You May Also Like
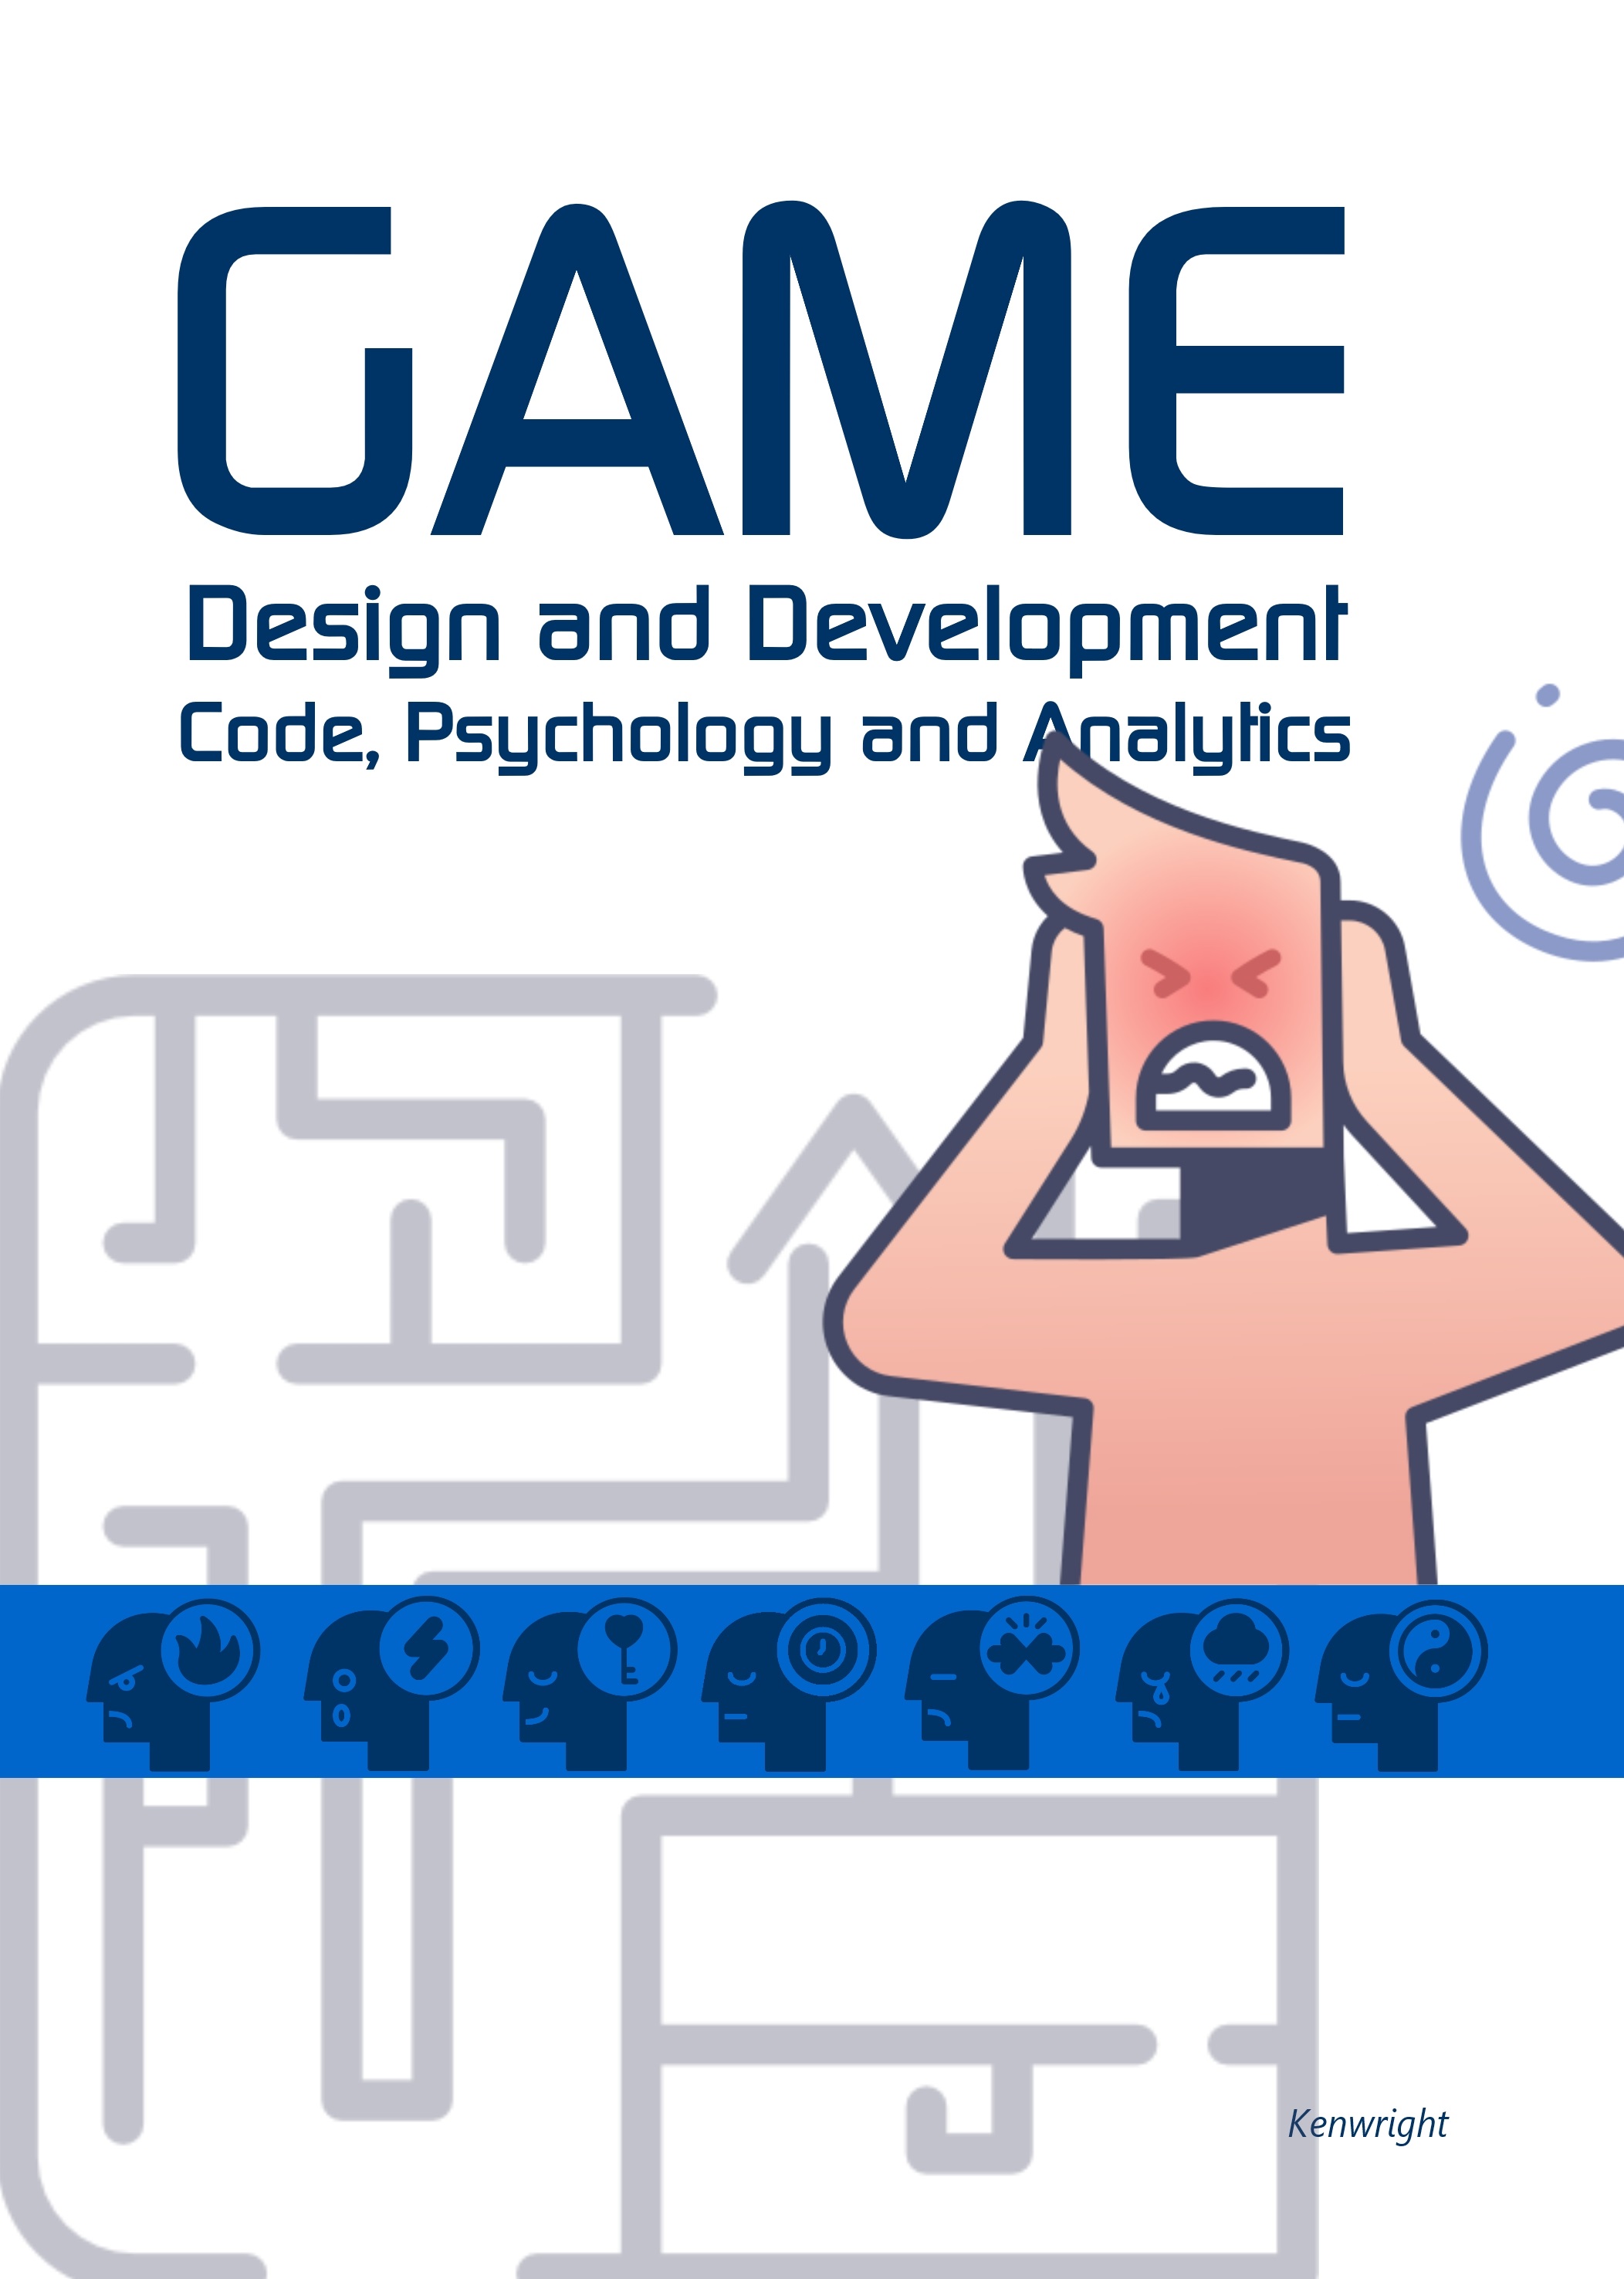
Game Design and Development: Code, Psychology and Analytics (Paperback)

101 WebGL and GLSL Projects: A Hands-On Journey Through 101 Programming Project Examples

JavaScript is NOT a Toy

How To Write Retro Games: Web-Programming

Code Classic Arcade Games: Web Programming
What Readers Are Saying

Olivia Young
Historian
As a scholar in the field of visualization, I find this volume to be an indispensable resource. The author's treatment of complex topics is both rigorous and accessible, making it suitable for classroom use as well as independent study. I highly recommend this book to anyone serious about mastering this subject.
Posted 14 days ago

User478
Verified Purchase
I completely agree with Olivia Young's review. This book exceeded my expectations!
Posted 10 days ago

Sophia Rodriguez
Bookstore Owner
This book changed how I think about visualization. The author has a gift for making complex ideas feel simple and approachable. It's rare to find a technical book that's this enjoyable to read.
Posted 17 days ago

User631
Verified Purchase
I completely agree with Sophia Rodriguez's review. This book exceeded my expectations!
Posted 6 days ago

Emma Clark
Tech Journalist
Excellent resource - packed with useful information!
Posted 20 days ago

Olivia Lee
Library Director
As a scholar in the field of visualization, I find this volume to be an indispensable resource. The author's treatment of complex topics is both rigorous and accessible, making it suitable for classroom use as well as independent study. I highly recommend this book to anyone serious about mastering this subject.
Posted 13 days ago

David Chen
Historian
This book changed how I think about visualization. The author has a gift for making complex ideas feel simple and approachable. It's rare to find a technical book that's this enjoyable to read.
Posted 4 days ago